Rfid Technology Empowers Various Industries
 2026-11-12
An item-level management system for clothing stores — from stockroom to sales floor (UHF RFID, 2026 edition)
A clothing store is one of the most demanding inventory environments in retail: thousands of SKUs in a dense style–colour–size matrix, garments that look almost identical on a rail, fast seasonal turnover, and constant movement between the stockroom, the floor, the fitting room and the door. This solution deploys UHF RFID (860–960 MHz, EPC Gen2 / ISO 18000-63; 920–925 MHz in China) at item level across the whole store, delivering four measurable outcomes:
• Stock counts roughly 40x faster: a full 8,000-SKU store counted in 15–20 minutes by one associate;
• Stock accuracy above 99.5% — the foundation of omnichannel fulfilment and “find in store”;
• Checkout in 3 seconds: the whole basket read in one pass on the bulk-read pad;
• Shrinkage down roughly 45%, with named-item alarms instead of a blind EAS beep.
Crucially for apparel, the same infrastructure also produces merchandising intelligence — what shoppers pick up, try on and buy — that barcode and EAS systems can never capture.
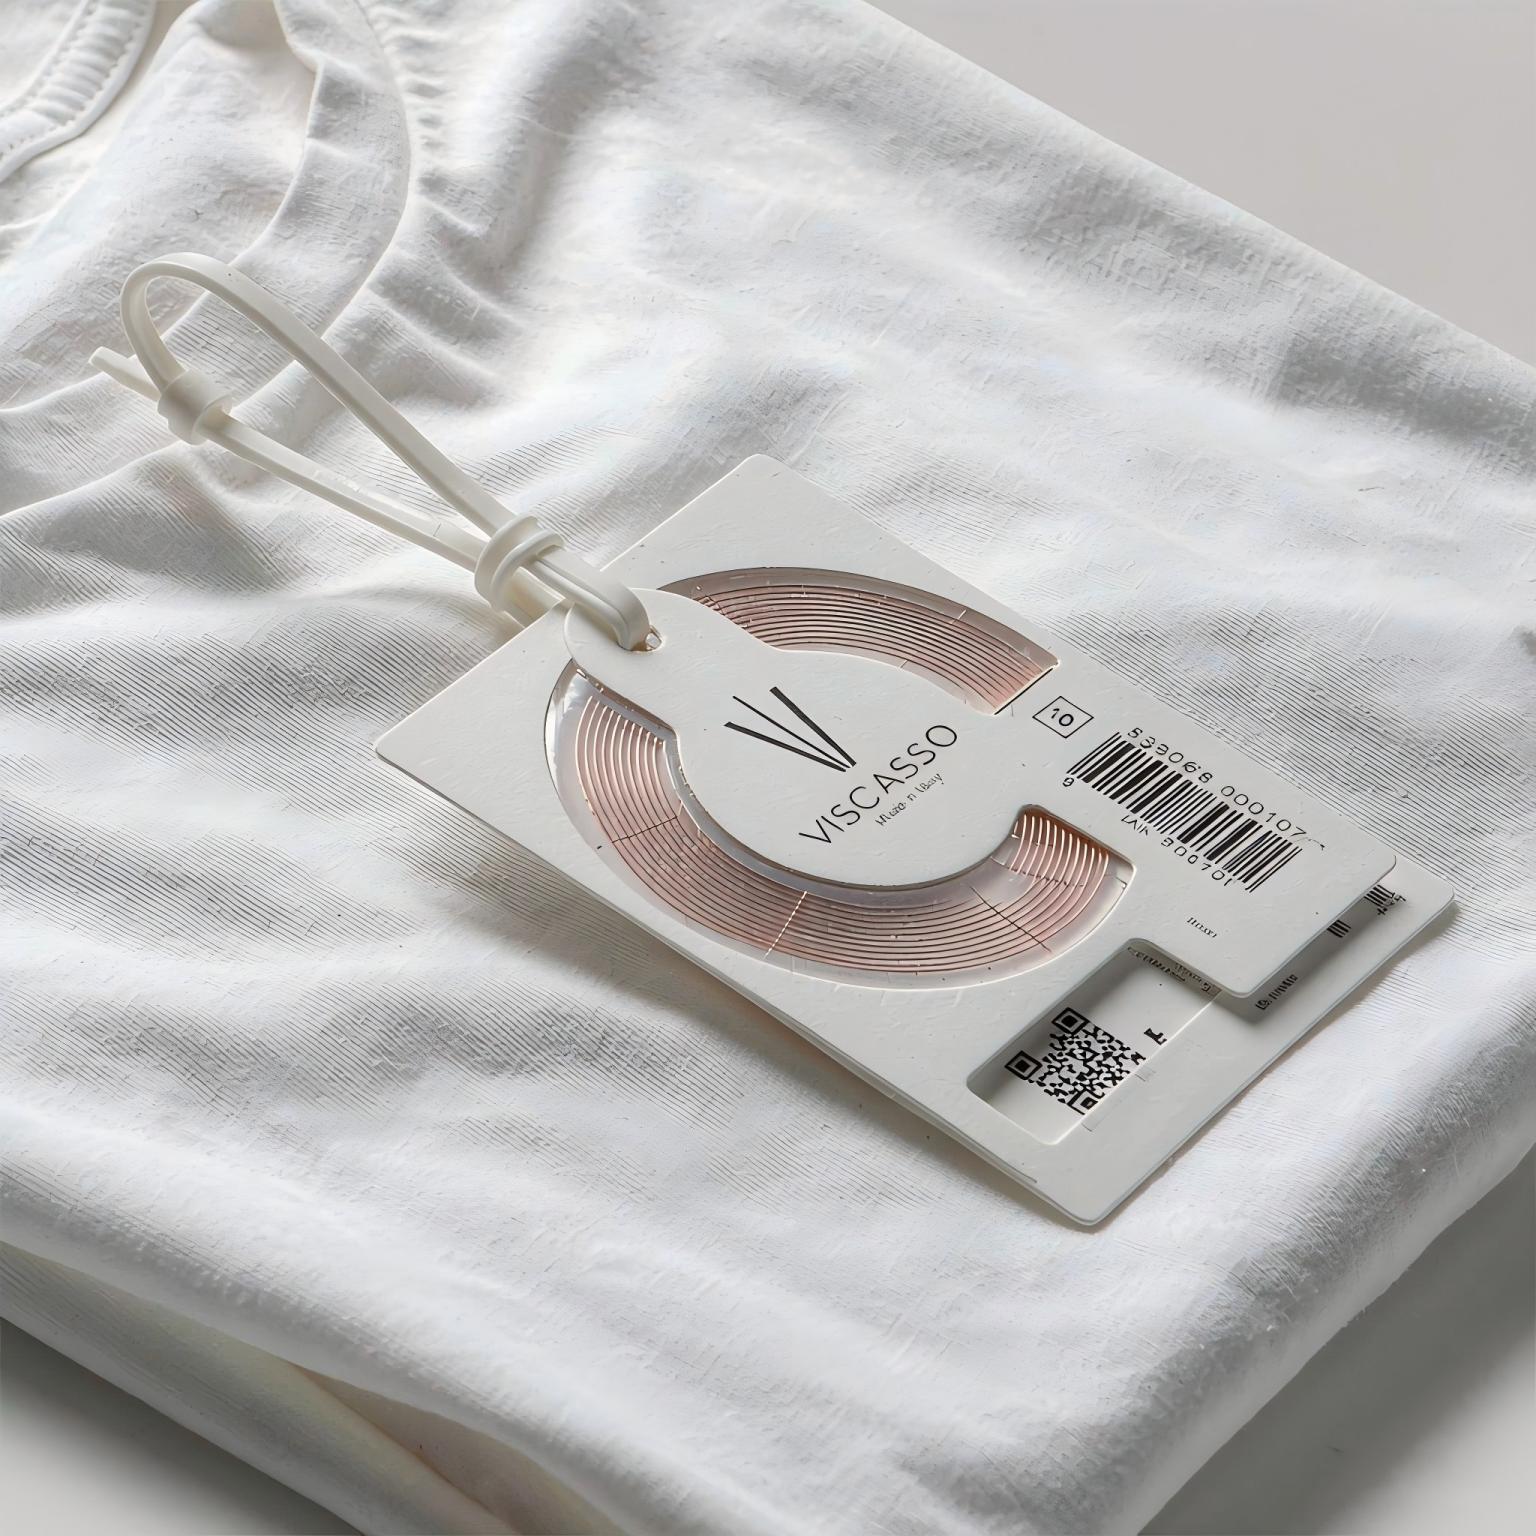
Fig. 1 — An apparel hang tag with an embedded RFID inlay: readable from several metres, through cartons and shopping bags, without scanning item by item.
One style in five colours and six sizes is thirty SKUs that look identical from two metres away. A mid-size clothing store routinely carries 6,000–10,000 SKUs, and every miscounted unit hides at item level where barcode sampling cannot see it.
A manual barcode count of a full store takes 3–6 staff working overnight. Most chains can only afford a quarterly or semi-annual full count, so the ledger drifts for months between corrections — and every correction itself introduces new errors.
Industry studies consistently place store-level record accuracy at 65%–80%. The webshop promises “available in store”, the customer arrives, and the item cannot be found — the single most damaging omnichannel experience.
Garments migrate: tried on and re-hung on the wrong rail, moved to promotions, left in fitting rooms or stockroom cages. Associates spend an estimated 20–30% of their time searching for items; the stock exists but cannot be sold.
Conventional EAS announces that something left unpaid, but not what. There is no link to stock records, no pattern analysis, and no way to separate honest mistakes from systematic theft — which in apparel frequently happens in fitting rooms.
Fast-fashion economics depend on selling the winner deep and killing the loser fast. That requires knowing, per style and per size, what is on the floor, what is in the back room and what is selling — data that manual processes refresh weekly at best.
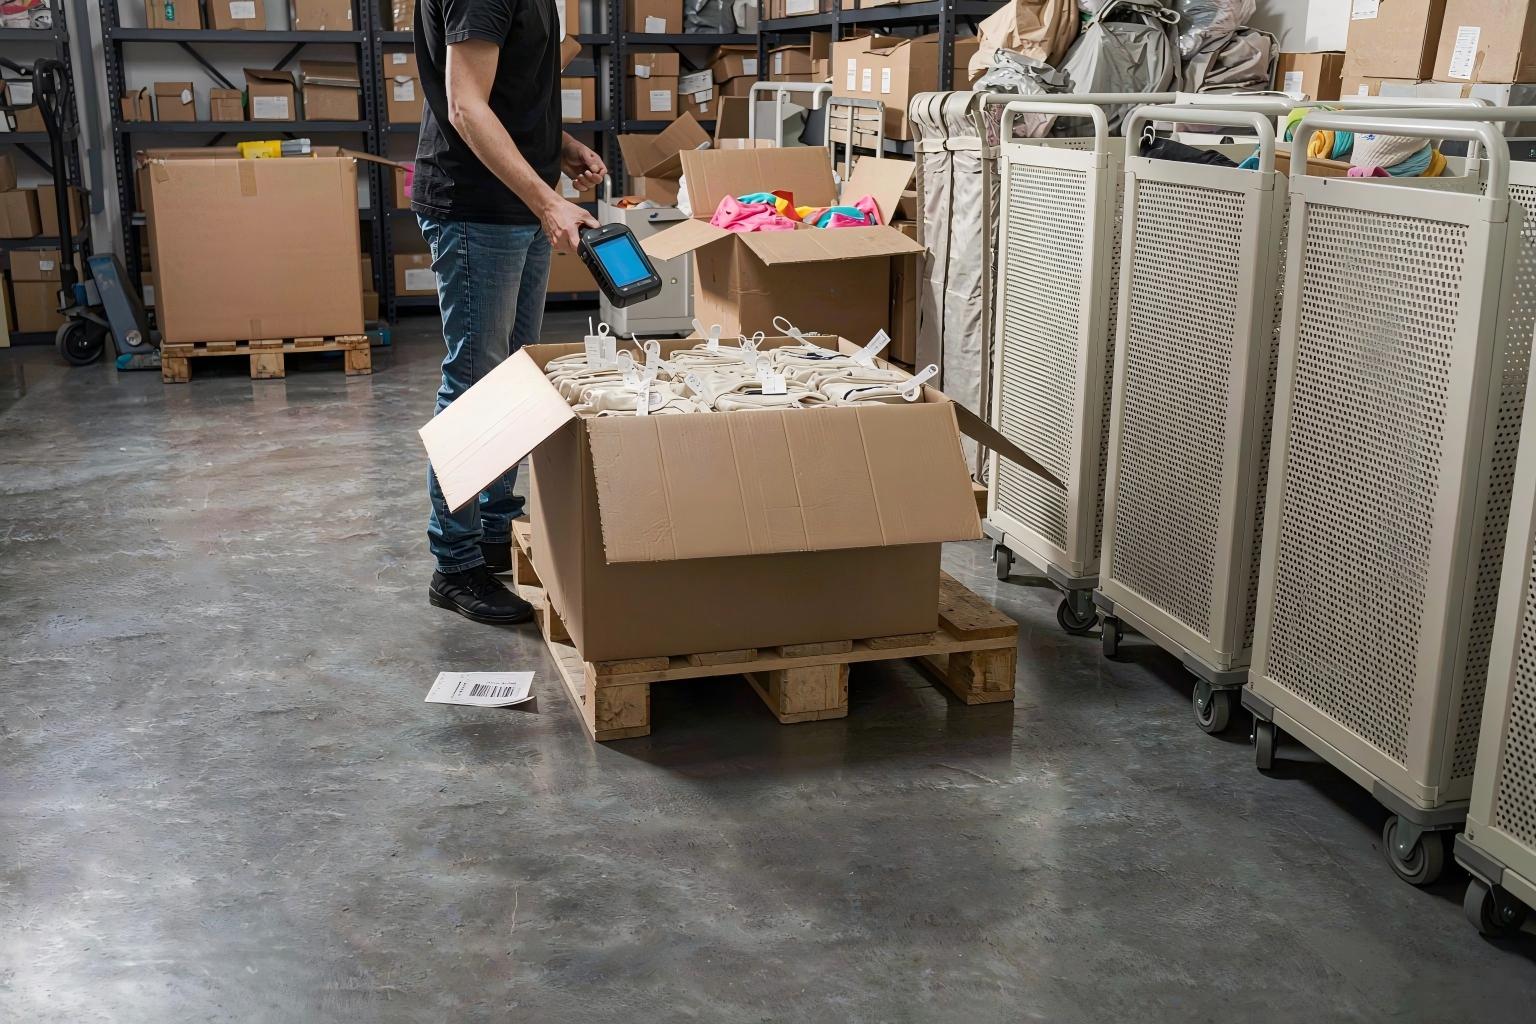
Fig. 2 — Backroom receiving: cartons of tagged garments are verified in one sweep, without opening and counting every piece.
Capability | Barcode / QR | EAS | HF / NFC | UHF RFID |
Identification | Item by item, line of sight | Presence detection only | Contactless, single item | Contactless, bulk, long range |
Bulk reading | No | Not applicable | No | Hundreds of tags per second |
Read range | <5 cm | ~1–2 m | <10 cm | 0.1–10 m, adjustable |
Works through bags / cartons | No | Yes (alarm only) | No | Yes, full item data |
Loss-prevention link | None | Alarm only | Weak | Alarm + named item |
Cost per item | ≈0 | $1.2–3.0 (hard tag) | $0.15–0.45 | $0.06–0.12 (hang tag) |
Conclusion: UHF is the only technology that simultaneously delivers bulk reading, adjustable range, item-level data and loss-prevention linkage — and at under $0.12 per hang tag, item-level tagging of every garment is economically viable across the whole chain. HF/NFC remains a useful complement for membership and engagement.
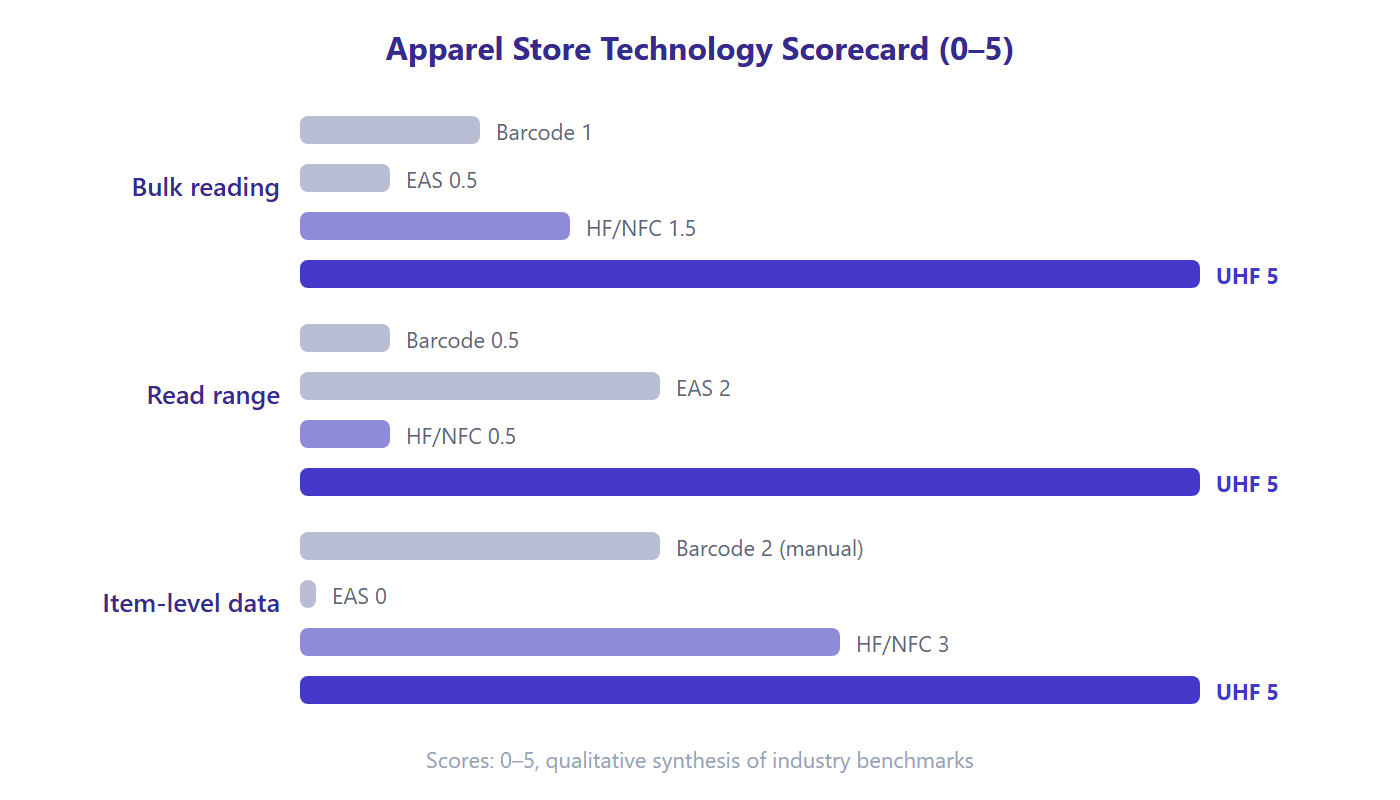
Fig. 3 — Capability scorecard: UHF RFID leads on every dimension that matters for clothing-store management.
The solution follows a proven four-tier architecture: identity, capture, edge and platform. Tiers are loosely coupled, hardware is brand-agnostic, and the platform tier exposes open APIs so the store management system, POS and ERP keep working while RFID capabilities are layered on top.
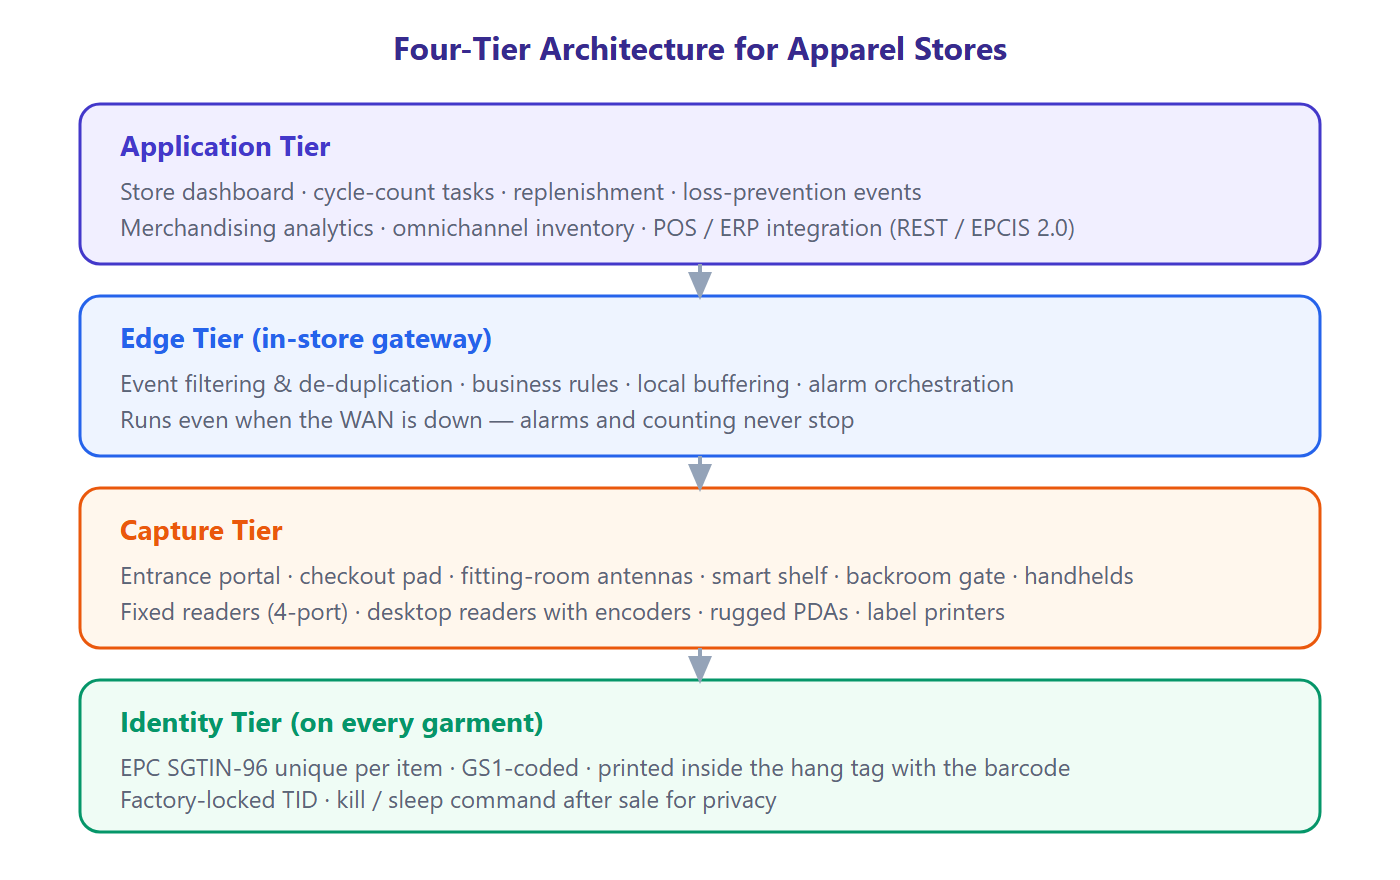
Fig. 4 — Architecture: the full data path from tag to application, with all devices aggregated at the in-store edge and exposed through open APIs.
Tags are the data source of the whole system. The guiding principle for apparel: embed the inlay in the hang tag itself — one identity per item, printed by the garment vendor on the existing tag line, with the barcode retained for transition.
Tag type | Best-fit categories | Unit cost (USD) | Notes |
Paper hang-tag inlay (recommended) | Apparel, knitwear, accessories | 0.06–0.12 | EPC and barcode on one card, no extra labelling step |
Woven / care-label inlay | Washable premium lines | 0.12–0.22 | Survives 60+ wash cycles |
RFID + EAS hard tag | High-ticket outerwear, leather, denim | 1.8–3.8 (reusable) | Identification and security in one; released at checkout |
On-metal tag | Shoeboxes, belt buckles, hardware | 0.30–0.75 | Offsets read loss near metal shelving |
Tote / cage tag | Stockroom transfer equipment | 0.45–1.20 | Container-level tracking between store and warehouse |
• Coding standard: GS1 SGTIN-96 mapped to the SKU master, so every item is globally unique and ERP-integrated;
• Anti-counterfeit: factory-locked TID verification; in-store encoders re-activate tags for returned goods;
• Transition plan: legacy stock re-tagged during seasonal changeovers; 100% of new goods arrive tagged from the vendor.
Read points are where data physically happens. The design rule: capture automatically wherever a business action occurs, instead of making people go to a device. A typical clothing store uses seven read points.
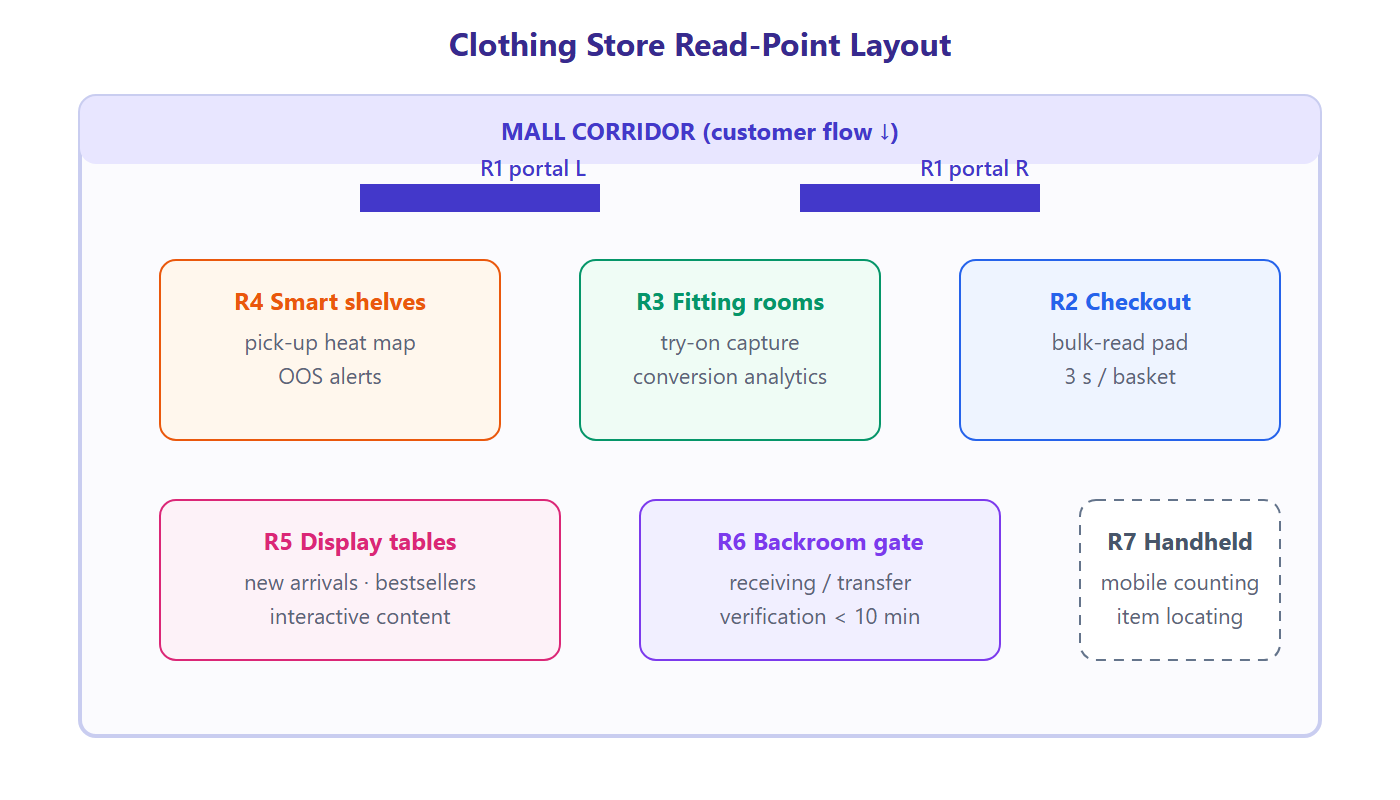
Fig. 5 — Store floor plan: six fixed read points cover goods in, sold, stored and lost; the handheld adds mobile counting and locating.
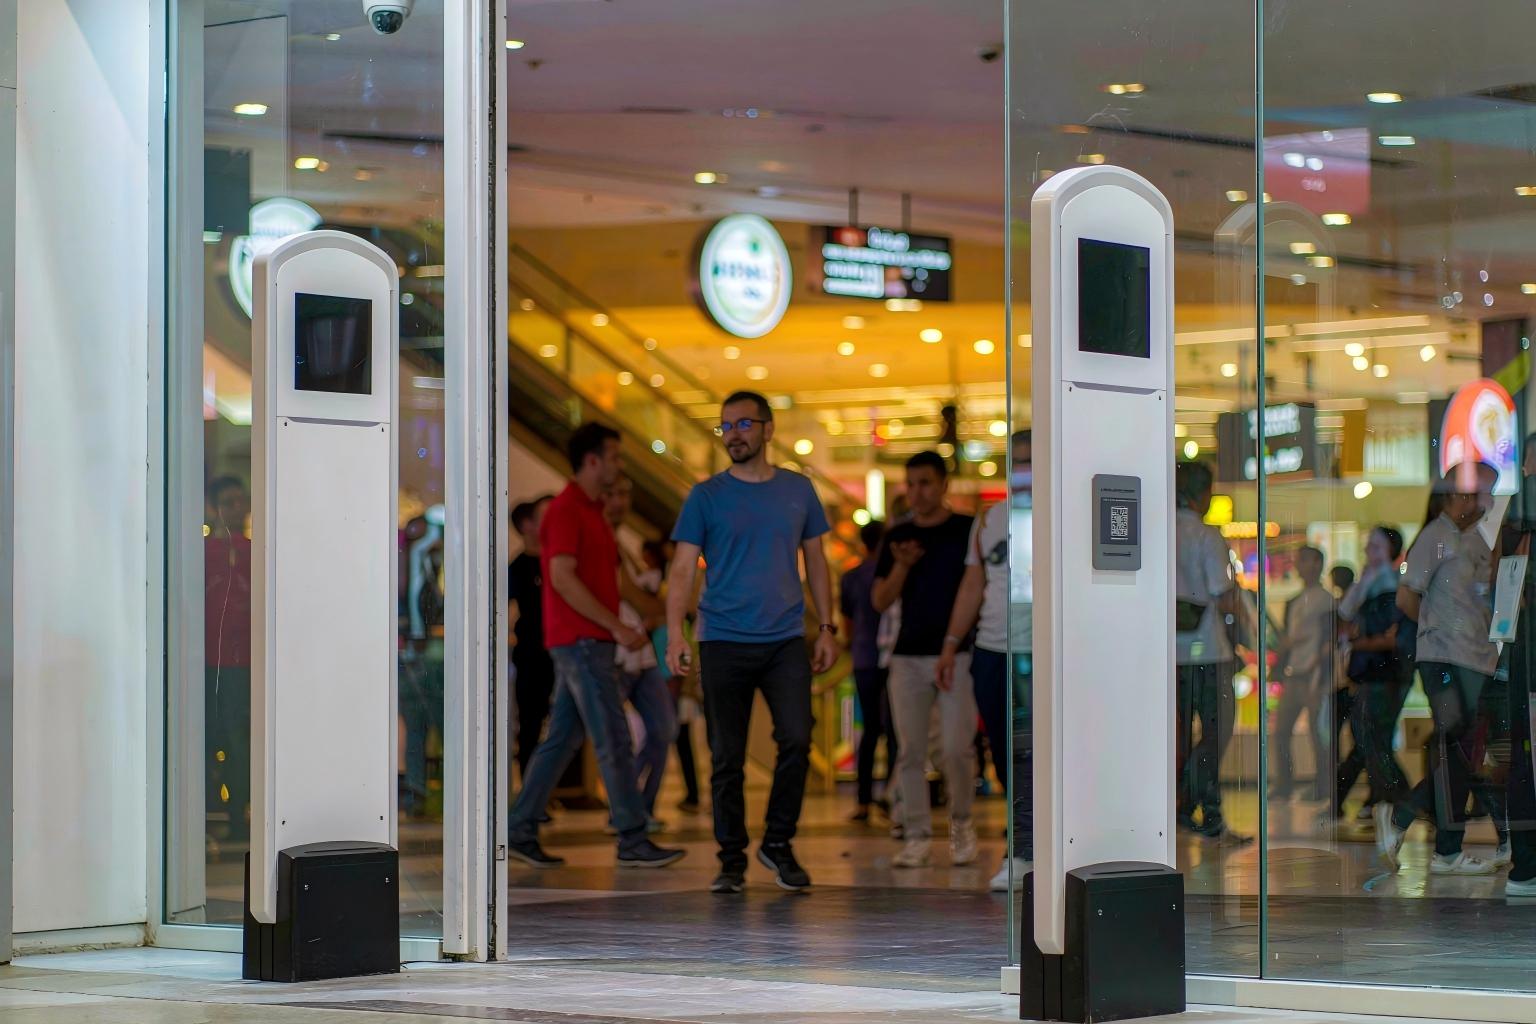
Fig. 6 — Entrance portal: slim pedestals replace legacy EAS gates and add named-item identification to every exit event.
Read point | Location | Recommended hardware | Business role |
R1 Entrance portal | Main entrance | 4-port fixed reader + dual pedestals | Unpaid-item alarm with item identity, footfall association |
R2 Bulk checkout desk | Checkout zone | Desktop reader + tag encoder | 3-second basket settlement, sales deactivation (kill) |
R3 Fitting-room antennas | Fitting-room entry | Low-profile embedded antennas | Try-on capture, screen interaction, theft deterrence |
R4 Smart shelf | High-traffic bays | Shelf antennas + controller | Availability, heat map, out-of-stock alerts |
R5 Display table | New arrivals / bestsellers | Table-top reader | Interactive content, pick-up data |
R6 Backroom gate | Stockroom door | Portal or desktop reader | Carton-level receiving and transfer verification |
R7 Handheld reader | Mobile | Rugged enterprise PDA | Cycle counts, item locating, return checks |
Lane engineering rules: pedestals 1.0–1.4 m apart for a standard 0.9–1.2 m doorway; reader power reduced within 3 m of R2 to prevent cross-reads; antennas tilted 15–25° toward the flow of travel; metal fixtures kept ≥0.5 m from antenna faces.
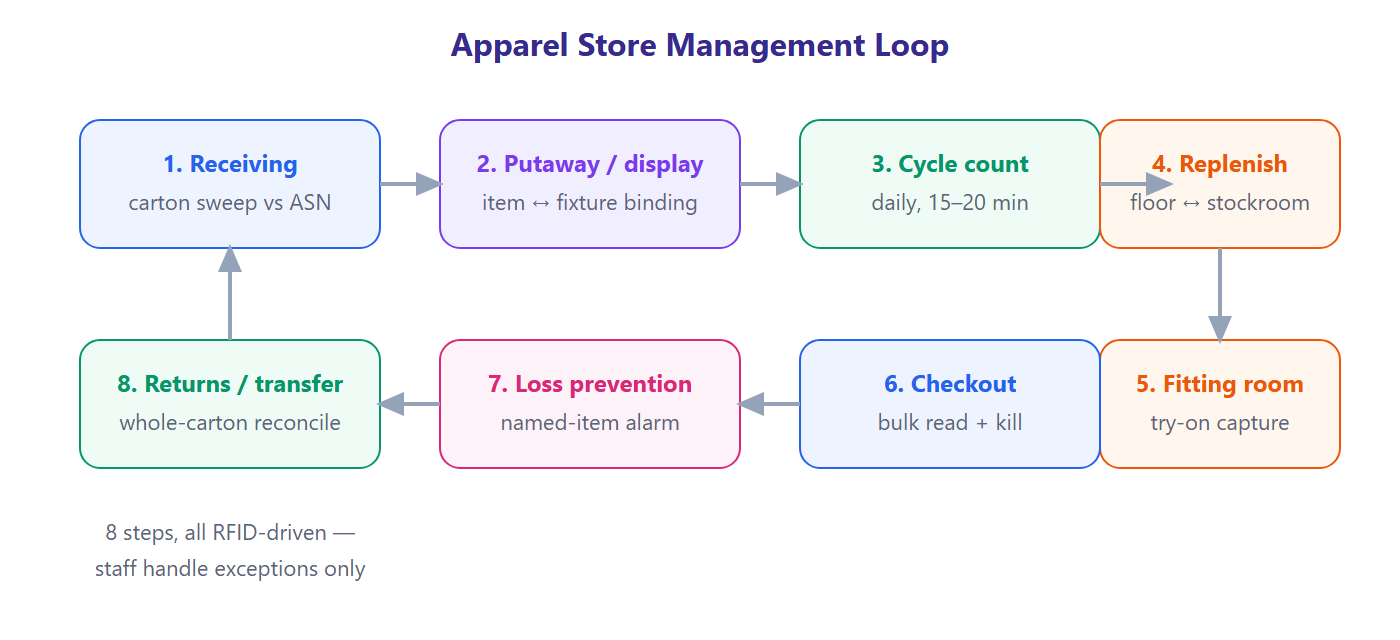
Fig. 7 — Eight core steps of store management, all driven automatically by RFID; associates handle only the exceptions.
Vendors synchronise tag data in advance (ASN, GS1 standard). On arrival the whole carton passes through the backroom gate: hundreds of garments are identified in about 2 seconds and compared automatically with the ASN. Overages, shortages and wrong items are flagged on the spot, cutting receiving from 2–3 hours to about 10 minutes.
The handheld reads the garment tag and the fixture tag together, binding each item to its display location; a misplaced item triggers an immediate prompt. Seasonal floor resets drop from two days to three hours, and size runs on the floor stay complete.

Fig. 8 — Handheld counting: one sweep per rail, whole fixtures read in seconds — the count moves from “all night” to “15 minutes a day”.
An associate walks the floor with a handheld and completes a full count of 8,000 SKUs in 15–20 minutes. The system compares results against the last snapshot by fixture and generates exception tasks — misplaced, missing, not yet put away — lifting accuracy above 99.5% and keeping the omnichannel promise trustworthy.
Antennas at the fitting-room entry capture which items go in. Honest shoppers get instant service: the screen shows size availability and outfit suggestions, and one tap calls an associate. Unusual patterns — many items in, few out — raise a discreet staff alert, closing the classic apparel theft loophole.
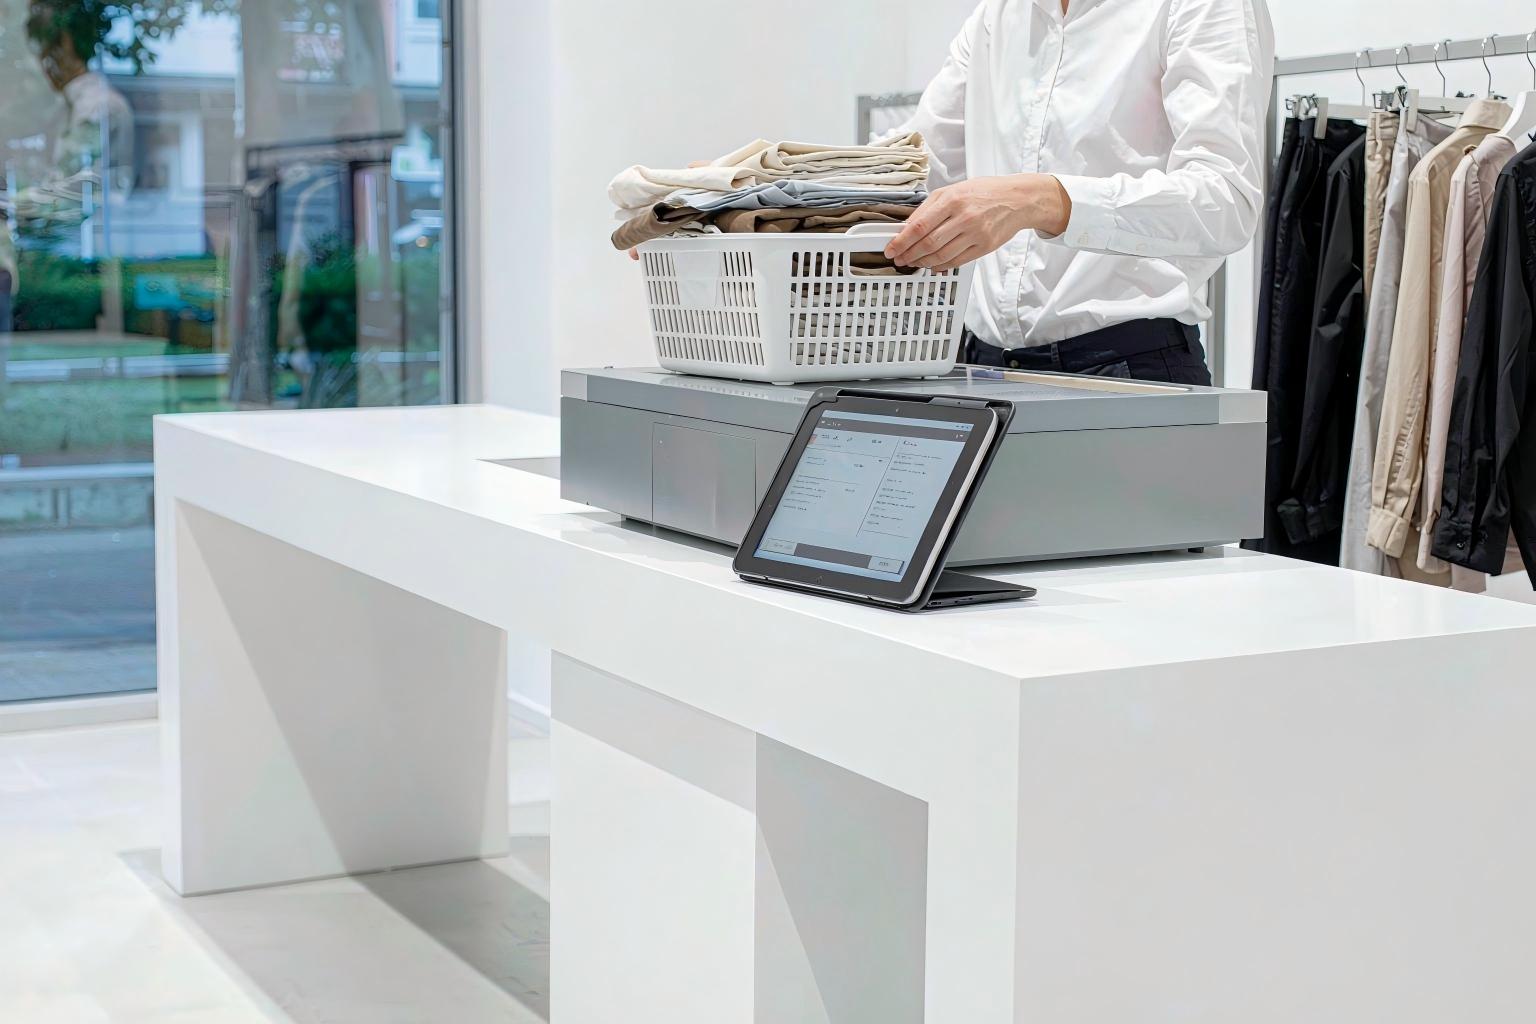
Fig. 9 — RFID bulk checkout: the basket goes on the pad and every item is identified and priced in one pass.
The basket goes straight onto the pad and six items are identified, priced and receipted within 3 seconds; items masked by metal trims or dense stacking trigger a quick top-up scan. Every sold item receives a deactivation (kill/sleep) command at settlement. Checkout throughput improves by roughly 60% and peak queues disappear.
When an unpaid tag passes R1, the edge gateway raises an audio-visual alarm within milliseconds and shows the exact item — name, style code and photo — on the checkout screen. Staff can separate forgotten items from deliberate theft, which is both friendlier and a stronger deterrent. Because fitting-room and exit events are correlated, internal-process loss becomes visible too; shrink falls by around 45%.
The hang tag identifies the item and its current price, so returns process safely without a paper receipt. For inter-store transfers, the carton is swept whole on dispatch and again on arrival, reconciling both directions automatically and eliminating transfer loss — the most common hidden gap in chain apparel stock.
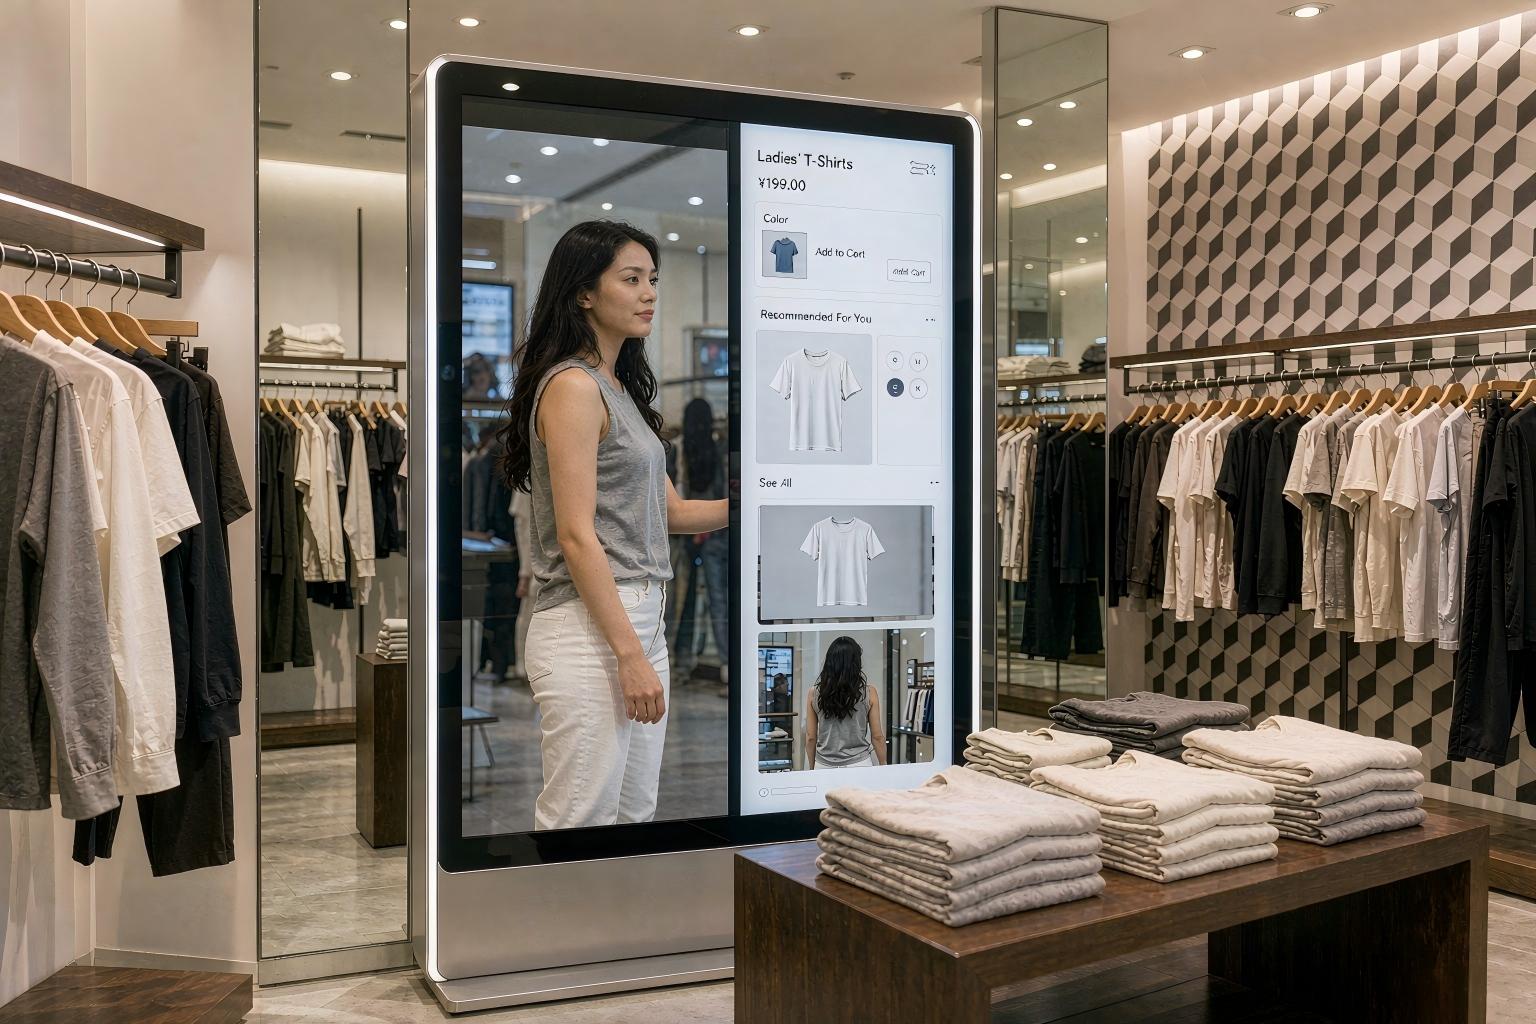
Fig. 10 — Smart fitting room: antennas identify the items taken in; the screen shows product details, size availability and styling suggestions.
Once the antenna identifies the items brought in, the mirror screen presents product details, availability of other sizes and styling recommendations, and the customer can call an associate with one tap. Try-on conversion improves by 25%–40% and units per transaction rise accordingly.
Antennas on high-traffic bays capture pick-up and put-back events in real time: heat maps guide visual merchandising, gaps or misplaced items trigger replenishment tasks, and a display table launches content — fabric story, styling video, member price — the moment an item is lifted.
Item-level accuracy is the foundation of omnichannel: ship-from-store, buy-online-pick-up-in-store and nearest-store sourcing can all be promised against real-time stock at 99.5% accuracy, cutting fulfilment failures by more than 50%.
Metric | Definition | Operational action |
Try-on conversion | Items tried on ÷ items picked up | Investigate pricing, display and size gaps on low-converting styles |
Pick-up heat map | Pick-up frequency by fixture position | Reallocate golden positions; relocate slow sellers |
Fitting-room attachment | Units bought ÷ units tried on | Refine outfit-recommendation logic and staff scripting |
Floor availability | SKUs present on floor ÷ SKUs that should be | Enforce a ≤2-hour replenishment SLA from stockroom |
Size-curve gaps | Missing sizes within a style on the floor | Trigger replenishment or substitution before the customer notices |
Linked to the loyalty programme, try-on and purchase records feed personalised recommendations and private-domain marketing — every item a customer tried or bought becomes precise input for the next campaign.
Item | Standard store <300 m² | Flagship 300–800 m² | Concept store |
Entrance portal R1 | 1 set | 1–2 sets | 2+ sets |
Bulk checkout desk R2 | 1 unit | 2 units | 3+ units |
Fitting-room antennas R3 | — | 2–4 rooms | All rooms + smart mirror |
Smart shelf / display R4–R5 | — | 2–4 positions | Per merchandising plan |
Backroom gate R6 | 1 desktop reader | 1 portal | 1–2 portals |
Handheld readers R7 | 1 | 2 | 3+ |
Tag encoders / printers | 1 | 1–2 | 2+ |
Edge gateway | 1 | 1 | 2 (redundant) |
Hardware budget (USD) | 11k–20k | 21k–39k | 42k–84k |
Note: indicative ranges covering fixed readers, antennas, handhelds and installation/commissioning — excluding software licences and tag consumables. Final pricing follows an on-site RF survey.
Model: a 300 m² clothing store with 8,000 SKUs and USD 2.1 million annual revenue (flagship configuration: hardware ≈ USD 28k, software platform ≈ USD 11k, tags ≈ USD 4k/year).
Benefit | Basis | Annual value (USD) |
Counting labour saved | 4 wall-to-wall counts → daily cycle counting; ~300 labour hours plus lost trading time recovered | 8k–13k |
Shrink reduction | Shrink 1.8% → 0.9% on USD 2.1 m revenue | 19k |
Sales recovered from OOS | Out-of-stocks down 30%, recovering 1.5–2% of sales | 31k–42k |
Checkout efficiency | Fewer peak-hour staff hours, less queue abandonment | 4k–7k |
Omnichannel uplift | Incremental orders from ship-from-store and find-in-store | Modelled separately |
Total | ≈ 62k–81k |
Conclusion: first-year fully loaded investment is approximately USD 43k (hardware amortisation + software + tags) against annual benefits of USD 62k–81k — a payback period of about 8–12 months. At chain scale the tag and software investment is shared, so marginal cost per store falls and payback shortens further. The +25% fitting-room conversion gain is upside and deliberately excluded from this conservative case.
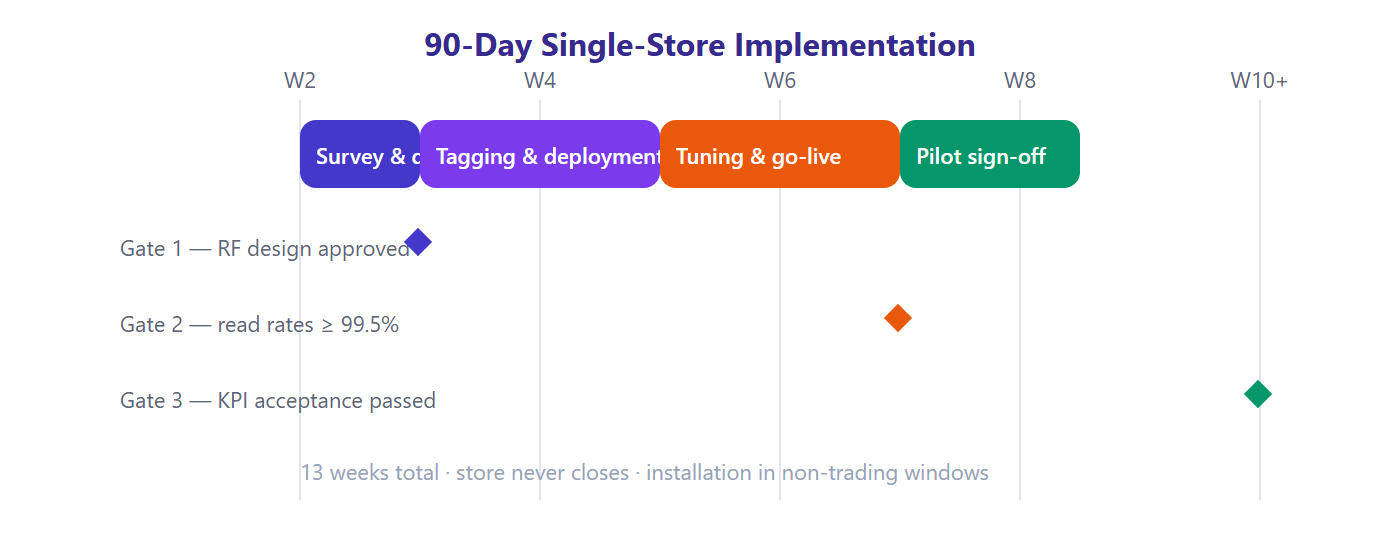
Fig. 11 — 90-day roadmap: a single-store pilot completes in 13 weeks, with three milestones acting as stage gates.
• Week 1–2 (survey and design): RF site survey, read-point and antenna design, SKU/EPC coding and master-data integration;
• Week 3–6 (tagging and deployment): hang-tag inlay encoding for all stock, portal/checkout/backroom installation, middleware and POS/ERP interfaces;
• Week 7–10 (tuning and go-live): read-rate tuning, cut-over of the core workflows, staff training and certification;
• Week 11–13 (pilot sign-off): two-week KPI observation, acceptance report against the criteria, rollout plan review.
• Portal read rate ≥ 99.5%; bulk-checkout read rate ≥ 99.9%;
• Cycle-count accuracy ≥ 99% for two consecutive weeks;
• Average checkout time (6 items) ≤ 8 seconds;
• 100% of staff certified on the core workflows; zero P1 incidents on POS/platform interfaces.
Risk | Scenario | Mitigation |
RF interference | Neighbouring stores on the same band, LED walls, metal fixtures | Pre-deployment RF survey; four-channel planning; on-metal tags near metal |
Portal cross-reads | Entrance portal reading in-store merchandise | Zonal power configuration, doorway geofencing, RSSI filtering |
Tag masking | Metal trims, foil packaging, dense rail stacking | Top-up scan fallback; on-metal inlays; pad geometry tuned for rails |
Network outage | Mall network failure | Edge gateway buffers locally; alarms keep running; auto backfill |
Privacy concerns | Tags remain readable after the customer leaves | Automatic deactivation (kill/sleep) after payment; published privacy notice |
Missing tags | Legacy stock, missed re-tagging | Backroom gate detects gaps and raises re-tag work orders |
Operational recommendation: maintain a daily read-rate dashboard and a weekly inspection routine (antenna mounting, power calibration, consumables). A read rate below 99% raises a ticket — read rate is the leading indicator of overall system health.
Metal reflects and liquids absorb UHF energy. Apparel stores are largely unaffected; for metal fixture zones use on-metal tags and adjust antenna angles. Shoeboxes and belt hardware should be tested on site before the tag specification is fixed.
After a completed sale — including self-checkout — the system issues a deactivation or sleep command so the tag no longer responds outside the store, and the store publishes a privacy notice. This is standard practice among leading global apparel brands.
Apparel hang-tag inlays currently cost about USD 0.06–0.12 at volume and continue to fall as annual volumes reach the millions. Printed together with the existing hang tag, the net additional cost is typically under USD 0.07 per item.
The platform tier exposes standard REST APIs and event subscriptions (EPCIS 2.0 compatible). Mainstream POS, ERP and store-management systems integrate through those interfaces — no rebuild required.
Choose readers with configurable global bands (China 920–925 MHz, EU 865–868 MHz, US 902–928 MHz). Wideband tag designs work across regions.
Hardware installation is completed over 3–5 non-trading windows; re-tagging legacy stock is scheduled in low-traffic periods. The store never needs to close. End-to-end, a single store takes about 13 weeks.
Select one representative store and cover the minimum loop of receiving, counting, checkout and loss prevention: one portal, one bulk checkout desk, one handheld reader and 2,000 encoded hang tags. Once the data clears the pilot exit gates, scale store by store using the configuration table in section 10.

Scan To Add

Scan To Add
Copyright © 2026 Shenzhen Zhishun Information Technology Co., Ltd All Rights Reserved.
Technical Support:SYSX





 182-7997-4925

 Home